Plot
You can plot, backend is provided by GNUPlot, so it should work great on linux and macos but behiaviour on windows is not known.
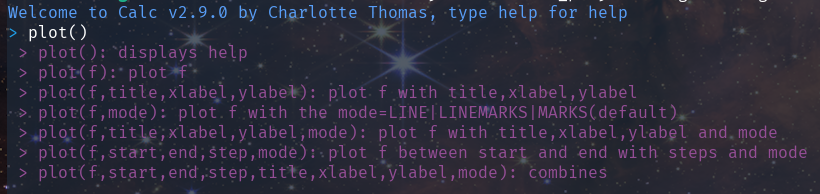
Help
To display the help just type help
Plot
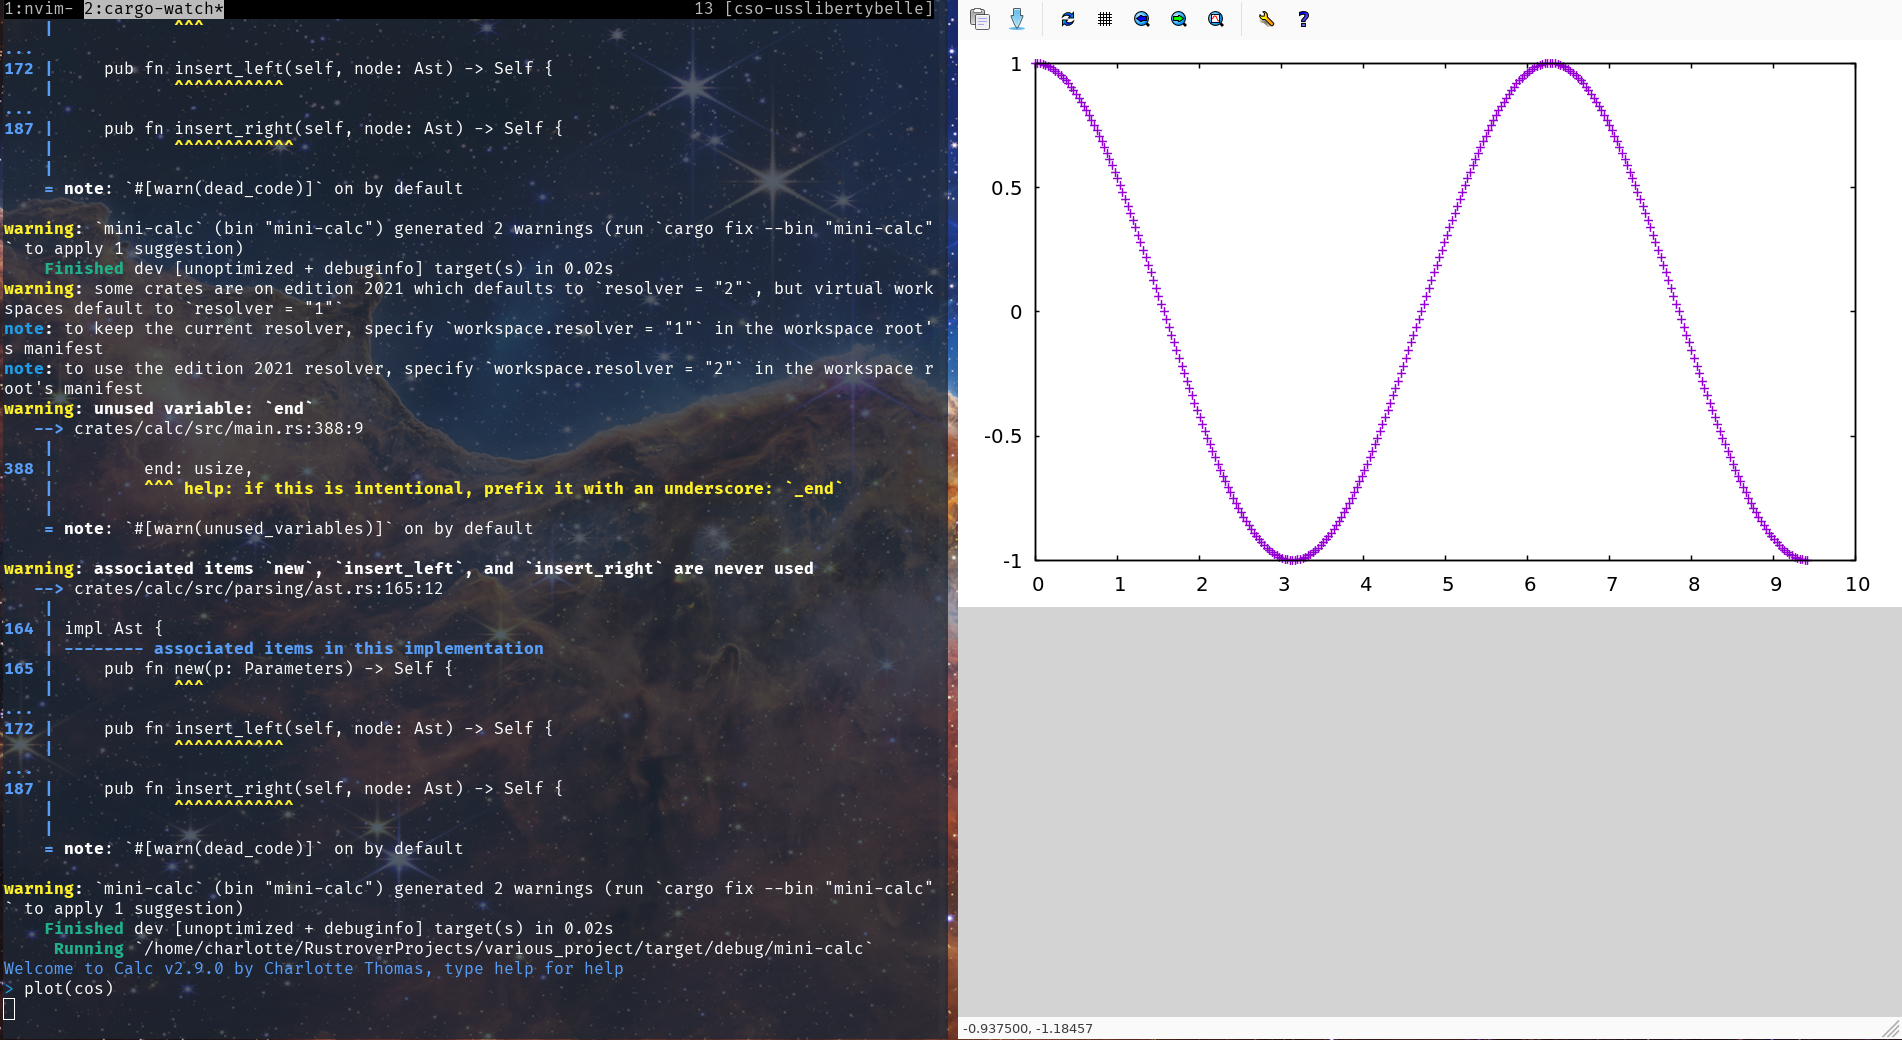
Default
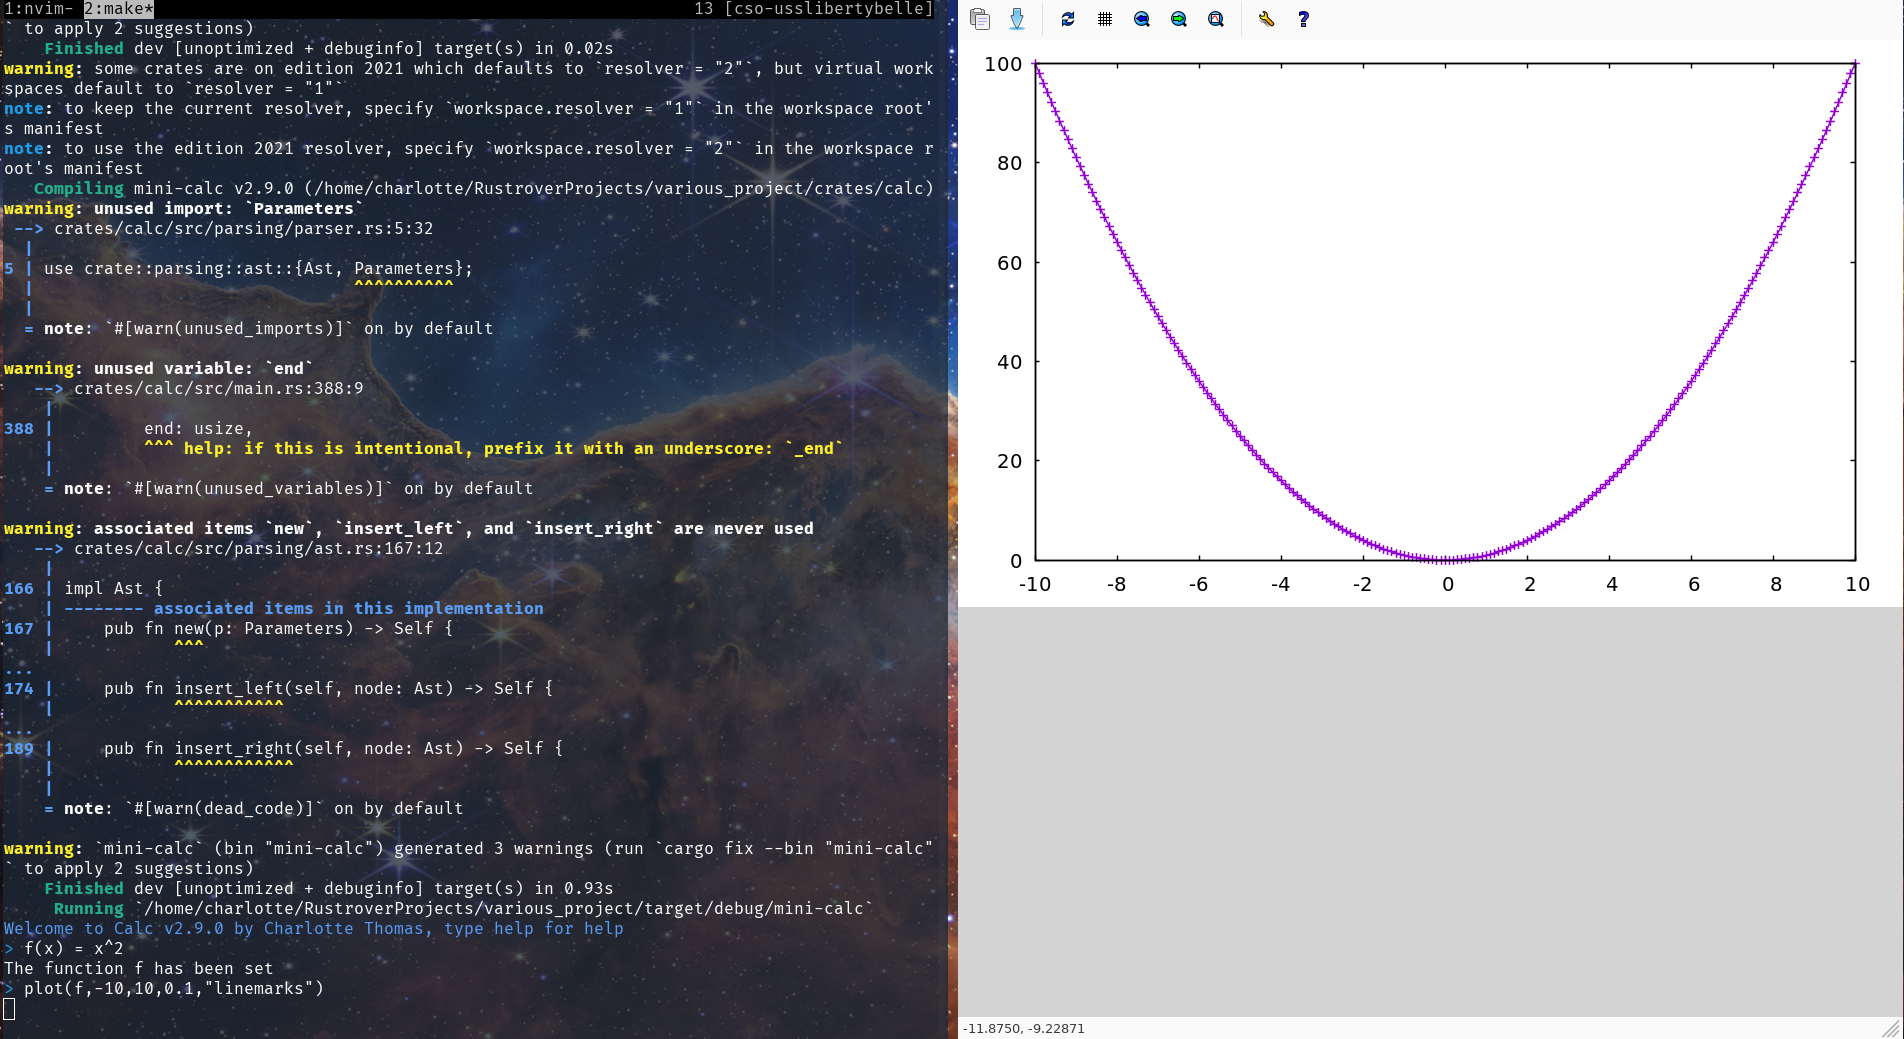
It's easy to plot a function by default, just type plot(fn)
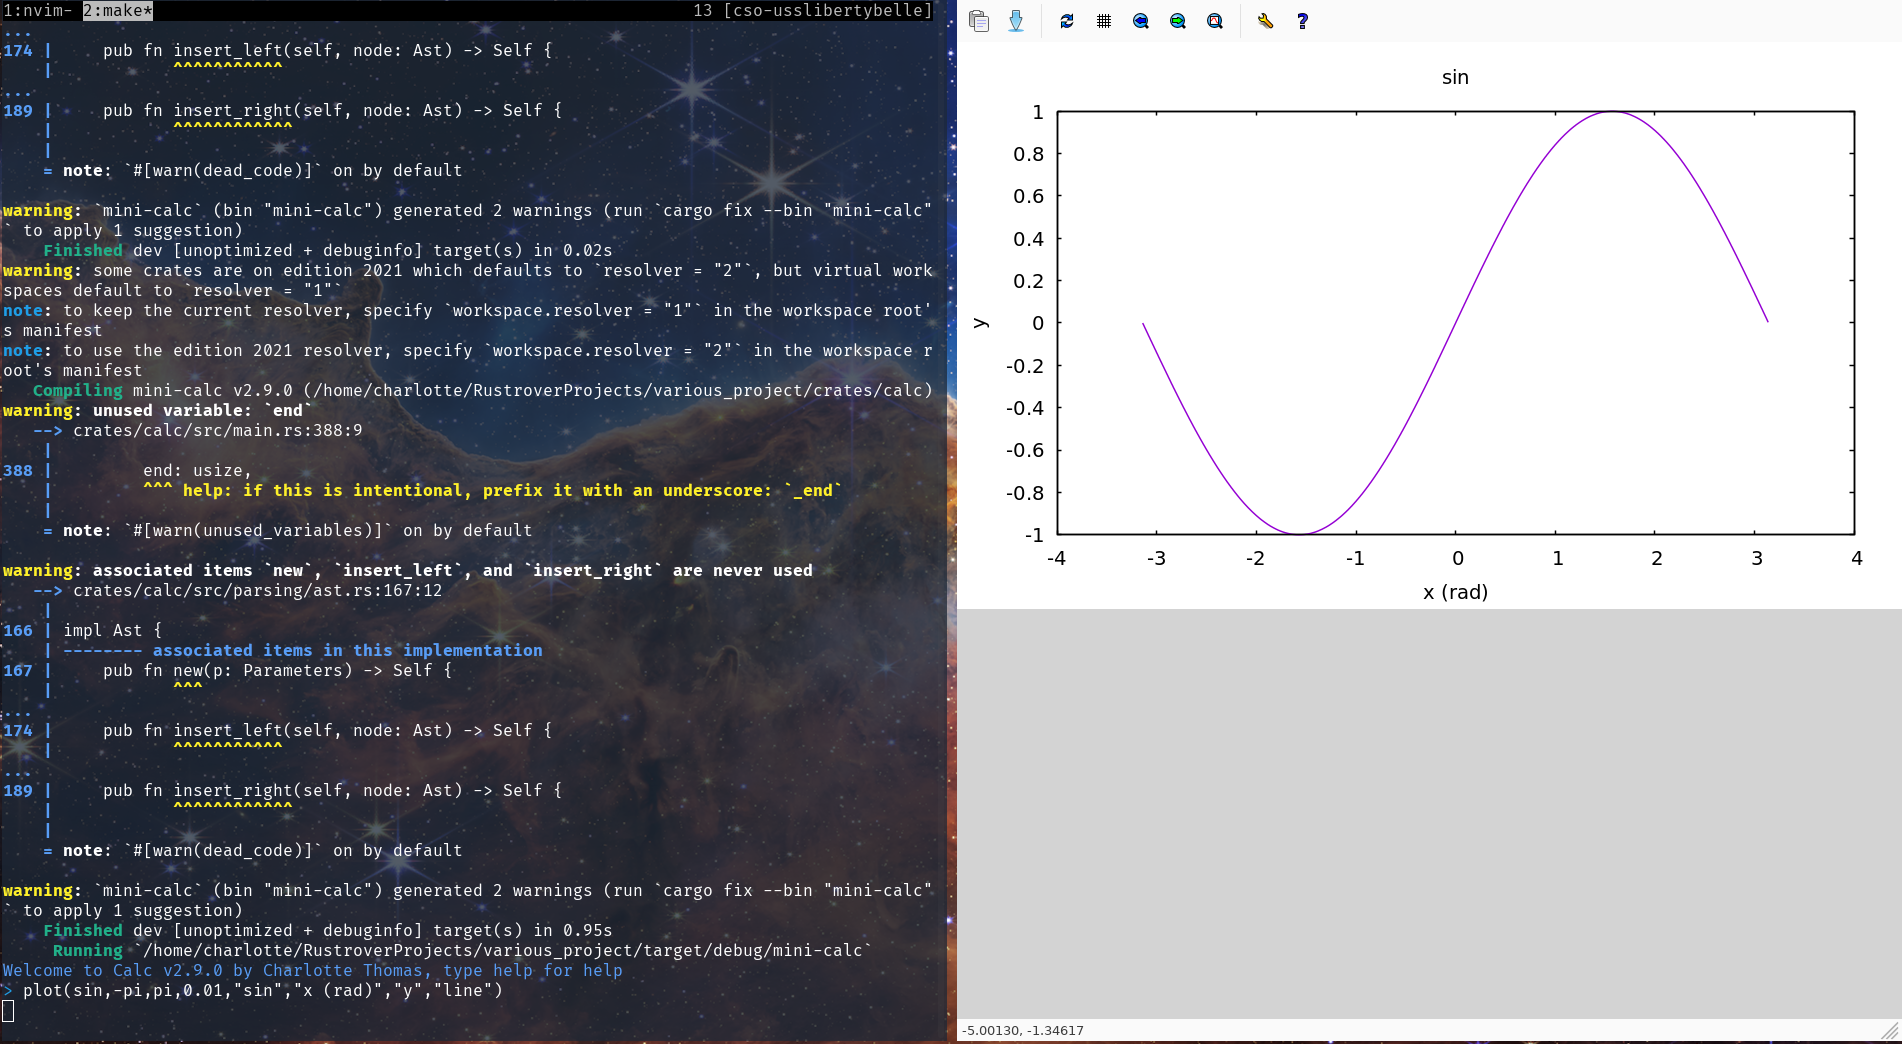
Options
A more difficult plot can be ploted by adding parameters
Plot your own function
You can plot your function!
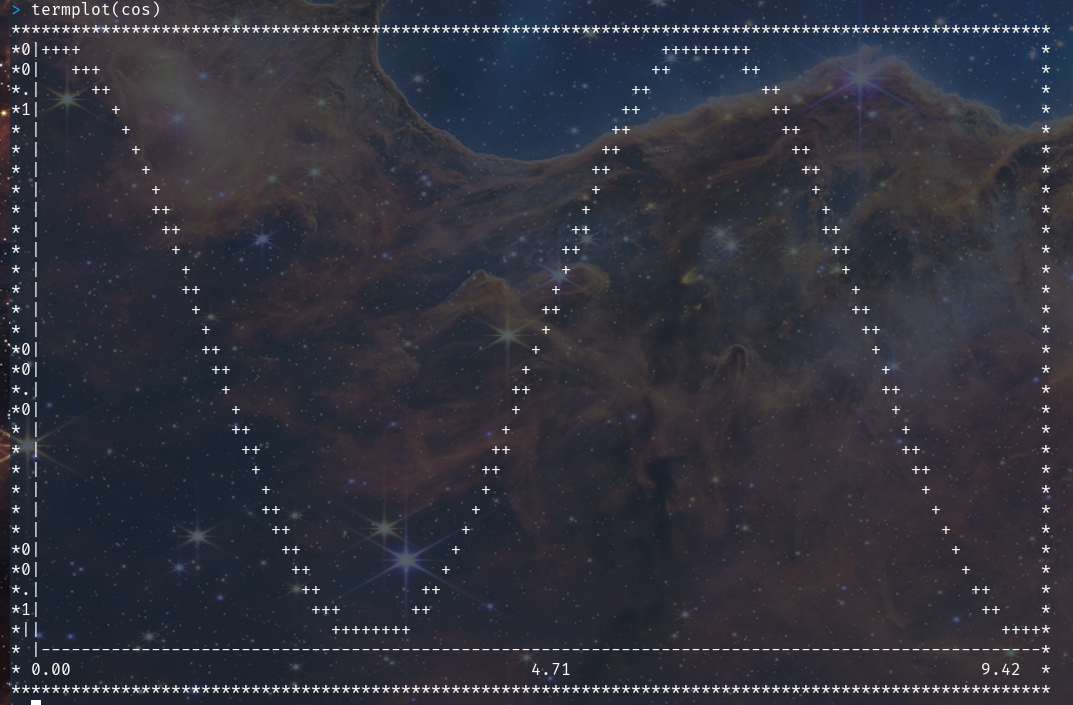
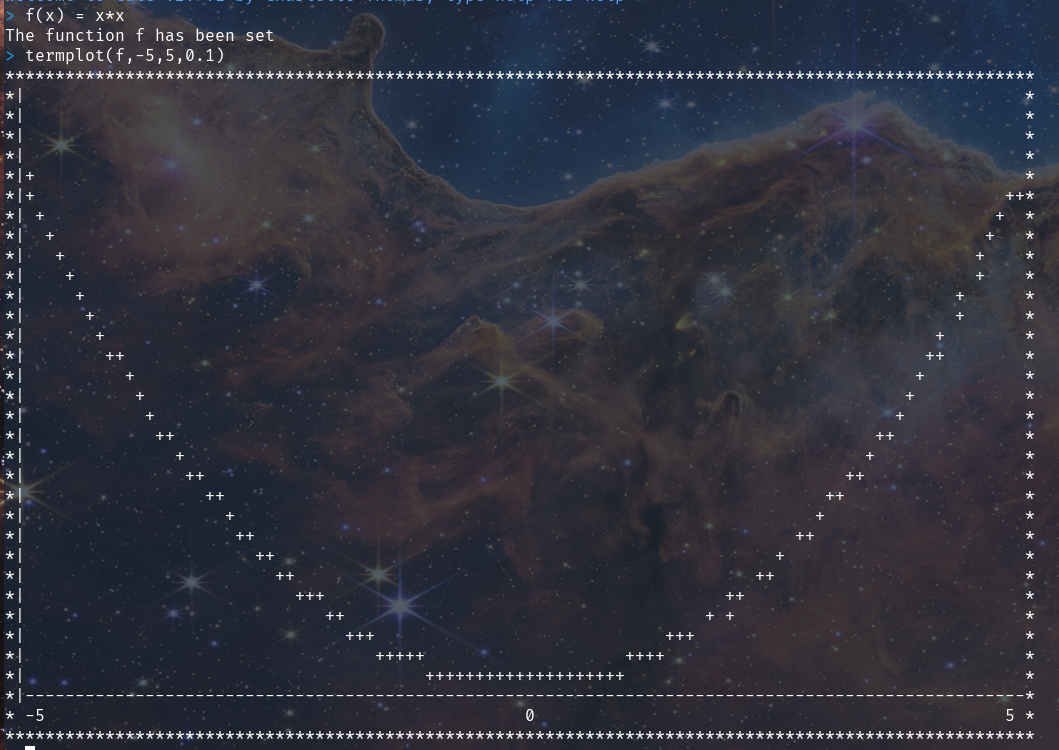
Terminal plotting
You can plot right into the terminal!
Default
The best example to show it is the square function between -5 and 5 with a 0.1 step. The x axis is automatically scaled but not the y axis for now.
With option
The terminal supports options!
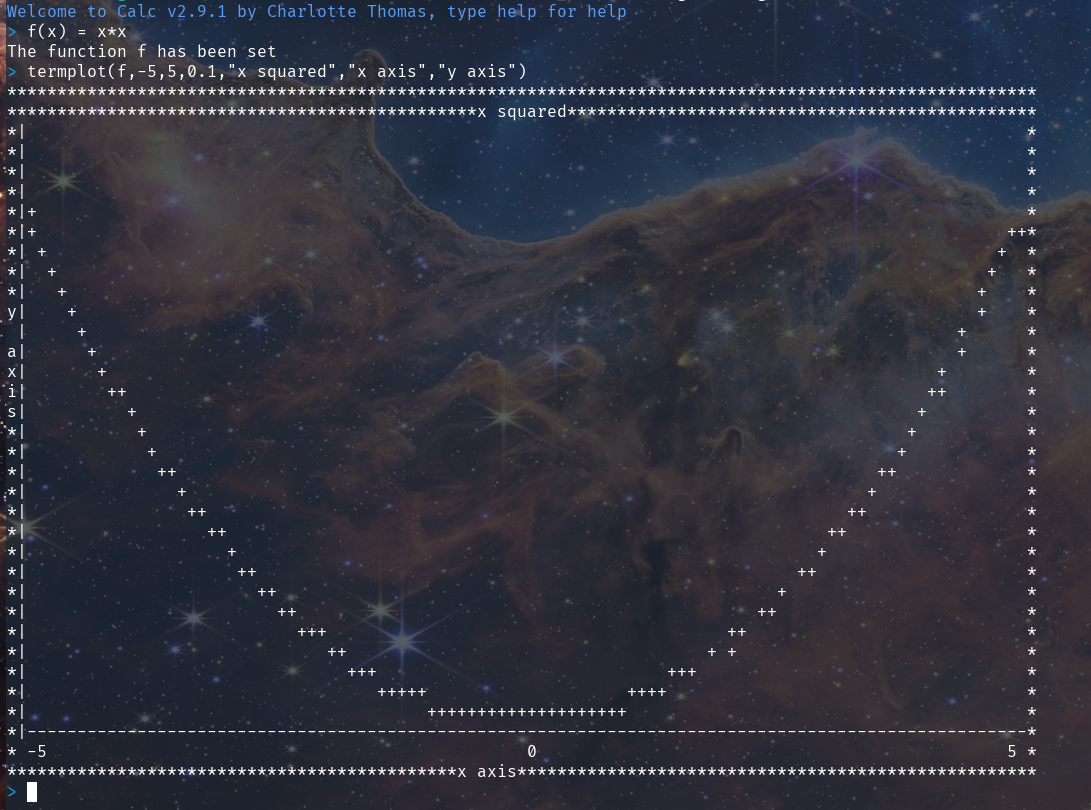
Auto y scaling
Now the y axis auto scales, and labels were added in 2.9.2 !